Hey. Sorry if this is a naive and obvious question, but I want to plot number of unique visitors cumulatively over time - cannot work out how to do it.
That is: x axis = time, y axis = total number of visitors the app has had to that date
For avoidance of doubt, the graph should be monotonic increasing (cannot decrease)
Hi,
You could create a Line chart report, add the Visitors metric to you graph, and then add a condition in the Filter dimensions section, which only looks at New visitors (Returning visitors is New). Here is an example of that:
This is only for unique visitors, so this will rule out visitors that have already been to you site before and this can significantly influence the chart. If you would like to include the returning visitors as well then remove the Returning visitor is New from the filter dimensions section. After you do that, you should have an overview on the data from all of your site’s visitors.
The line on the goes downwards because on April 18th there is not enough data that could be gathered. I am sure that it will eventually go upwards during the day.
Also, it seems that the data started being gathered around April 11th. There will be no all time data accumulated for the period before this date as the data starts being gathered as soon as there is a Piwik PRO installation code incorporated into your site’s source code. However, you should be able to filter out the data as soon as you create and save the report in the line chart report section itself:
Digging deeper, i am struggling to understand the user segments and am confused by the following inconsistency. I have created the following example to illustrate the point.
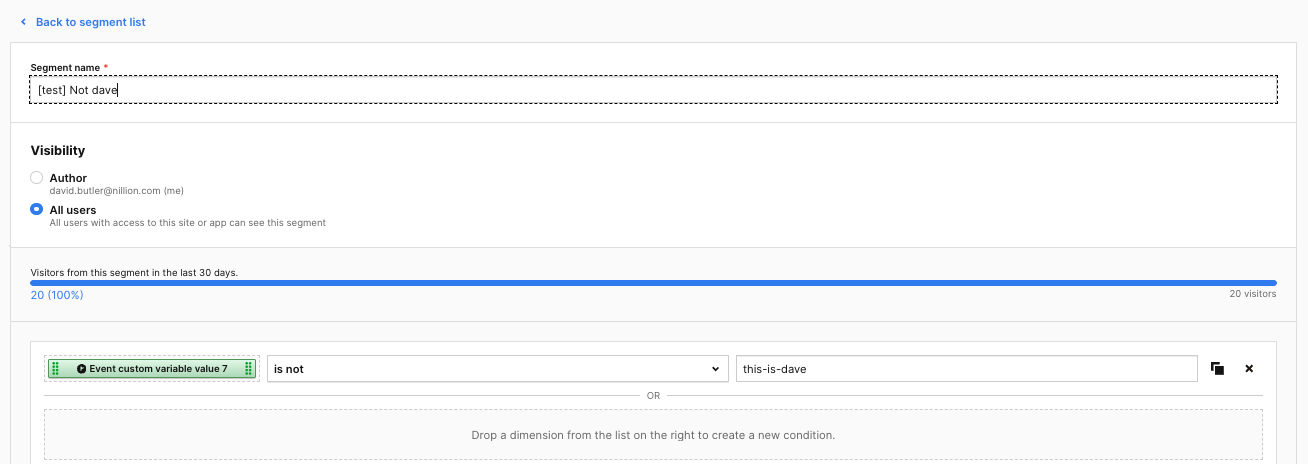
I have a user segment that is just me: identified by “this-is-dave” by the event that we are using to track users (users enter this custom event when they opt into our SDK telemetry). This is shown in screenshot 1.
Then screenshots 2 & 3 show a dashboard for “all visitors” and “not dave” (everyone but me).
I plot two things in the dashboards:
Number of unique visitors
Page views by Dave (screenshot 4 to see this definition)
As expected the page views has data for “all visitors” and no data for the “everyone but dave” segment.
However, why does the number of unique visitors remain the same? I would expect the number to decrease by 1 when looking at “everyone but dave” compared to “all visitors”
Custom variables are not a feature that should be used for the custom event recognition and that is why it does not remove you from the report as soon as you apply the segment. Could you share the structure of the custom event that you are using to identify if someone “is Dave” or “is not Dave”?
The best way of segmenting visitors is to assign a User ID to them. Also, if you do not wish to see yourself in the reports, then you could play around with the Administration settings, which will allow you to ignore traffic coming from you or your teammates. Here is an article on that: How can I ignore traffic from my office? | Piwik PRO help center.