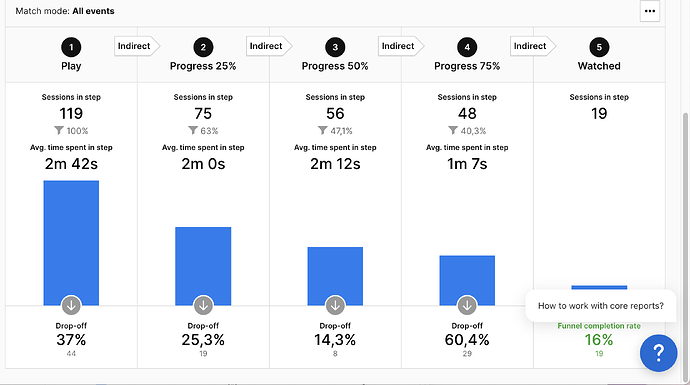
Video plays: How would you create this report?

Hi everyone :slight_smile:
We’d like to have these 2 reports set up, but I’d like to know if it’s possible, and if you can shed some light on how to better achieve them:

  • A report with an explorer table listing all video names + click urls, ordered by number of unique plays, and counting how events under each % progress: to see whether a given video on a given url has more 50% progress, and others only reach 25%…but at a glimpse, on an explorer table.

Thank you
Elena

Hi @Elena_Benito_Ruiz,

Could you elaborate on what you mean by click urls here?

Hi @Elena_Benito_Ruiz - I understand you’re looking for something like this?

I don’t think it would be achievable in Piwik itself as basically only ways to get your “own columns” is to have additional counter as a goal, and then making it a calculated metric. Apart from distinct value counts that you can invoke of course. I think I’m not mistaken summing it up like that - anyone correct me if I don’t know about something :smiley: Either way its easy to work with those events in some other software like I did in above example in Power BI. URLs for the vids I think could be captured as custom dimensions and later made clickable in such a report as well.

1 Like

hi @anthonybartczak the page url actually, where the video is embedded and played :slight_smile:

@gonerator @anthonybartczak
It would be great to have a report like this:

THANK YOU

@gonerator sums it up pretty nicely, it’s not possible as of now unless you use one of the suggested solutions (additionally counting goals, using a BI tool or a different report structure). It’s pretty much the same case for:

We have some plans to improve calculated metrics in a way that enables you to use filters for events. This would probably solve the problem but I can’t share any dates for now.

2 Likes

As you showed the example in Google Spreadsheets, I realised that there is Piwik PRO Google Sheets integration that one could use. I made a video showing how to proceed, I hope it will be helpful for you :slight_smile:

6 Likes

This is absolutely fantastic @gonerator :slight_smile: Thanks a lot
I have a few questions for you or anyone who might want to answer :slight_smile:

  1. Can we leave the due date empty so it always picks data until today? or can this run automatically so it update data monthly, for instance?
  2. I’ve noticed I only see Progress 25, is this because the report doesn’t show other progress if countA = 0, right?
  3. I have these other custom events 25,50,75 and these are yielding 0.
  4. Our videos don’t play automatically, I can’t understand why we have more Pauses than Plays, then. It might be Friday’s brain fog but I don’t get why.

Probably better explained here -because of the visuals, not my English :stuck_out_tongue:

1 Like

@Elena_Benito_Ruiz please find my answers below :slight_smile:

ad 1. Unfortunately the UI of GSheets integration doesn’t allow to leave field empty for such a purpose, nor relative date is implemented there HTTP API — Piwik PRO Analytics Suite 18.11 documentation
Also, a new sheet in the spreadsheet is created with every data download, there’s no “refresh” as such, as far as I’m concerned

ad 2. That may mean that you either didn’t choose it in the filter, or there is none of such values in your current dataset, as what is displayed is based on the data that’s underlying.

ad 3. event with “custom_event_action” of “25%” and not “Progress - 25%” is most certainly a scroll event, so it won’t give you a count for Video category. I see on the video you have those selected, the video events start with “Progress…” so scroll down the list to check those for filtering :slight_smile:

ad 4. It may be that Play event is not captured properly due to some issue, if there are some, but not enough as there should be in theory. It should be tested - I’d start with segmenting the sessions that show such behaviour and checking their OS/Browser configuration to try and check on some specific setup. Also check on the amount of “Resume”, I had a case where instead of “Play” I was getting “Resume”, don’t remember the reason though and whether that was for YouTube or HTML5…

Overall your situation may be calling for using something more stable for reporting than Google Sheets, for example Looker (a.k.a. old Data Studio), Tableau, or Power BI - depending on your preferences.

The way I do my reporting is using https://logbaker.com/ and then refreshing such downloaded files in local PowerBI workbooks - PBI is at least free to use or included in majority of O365 subscriptions (I specially keep VM with Windows on my Mac to run Power BI Desktop though).

There are also Piwik PRO connectors for Tableau and PowerBI although I somehow just keep working with raw files #oldschool :wink: it’s just easier to tackle bigger amounts of data by having it in files that I can work on, because if download of big data chunk fails, one just has to try again. That’s why I made LogBaker :smiley: Then, refreshing the data is also a pretty straightforward process because you just put another CSV for another time period into a directory and click “Refresh” in Power BI, that’s at least how I roll

Hola @gonerator :slight_smile: dzien dobry!

  • ad 1: it’s really a bummer there’s no way to keep such video report (or any report for this matter) refreshening automatically or something similar. So it’ll be manual input/action. OK.
    I used to have almost everything on Looker when I was on GA4, so GA4, GSC, and some custom sheet data all pushed to Data Studio. I truly miss that.
  • ad 2: I didn’t see any other option in the dropdown list: Just Progress 25. So it might that there’s 0 data, that’s very depressing. And we will have to double check with youtube analytics and cross that info to see if it’s really true.
  • ad 3: ahhh true, it didn’t occur to me! the built-in scroll event! :smiley:
  • ad 4: great tip, we’ll have to start testing because this doesn’t make sense at all.

I have zero knowledge of powerbi and it’s not on my list for now, I don’t have time to learn this tool. I am not sure I would be able to know how to use Logbaker or maybe I don’t get it. How to use it for Data Studio/Looker for instance?

THANKS!

edit @gonerator
On piwik I do see we have progress 50, progress 75…and there are more plays than pauses/resumes


@anthonybartczak do you happen to know why when I use the piwik → sheets, I can only see data for Progress _25 for Video Youtube and rest of custom events are not appearing? however on Piwik’s tool I do?

Captura de pantalla 2024-02-26 a las 17.11.25

Hmm, could it be a different date range?

If possible, you could share the spreadsheet URL in a private message.

Unfortunately the integration does not enable scheduled automatic repulls / data updating.

We automate of import piwik offline goal conversions to google ads leveraging a google sheets intermediate and to my best understanding this requires supermetrics to automate

hi @Elena_Benito_Ruiz , sorry for not noticing your question here - in such a case I would double check both the limit for events query (you may have a lot of other events) and time range for the data you’re pulling. Google spreadsheet can handel 100k rows so you can set limit in the query for 100k as well and try then, but also check that in Piwik. It’s useful to make report I call “events by type” so you know what are the numbers of specific groups of events, pageviews and other types that you track. Let me know, I’m curious about the outcome :wink:

1 Like

sorry for this @gonerator because I got sidetracked and I haven’t had time to resume this again, but I’ll do and ping you!

1 Like